 How Much Does IT Downtime Cost? (Simple Formula)
Answer at a glance:
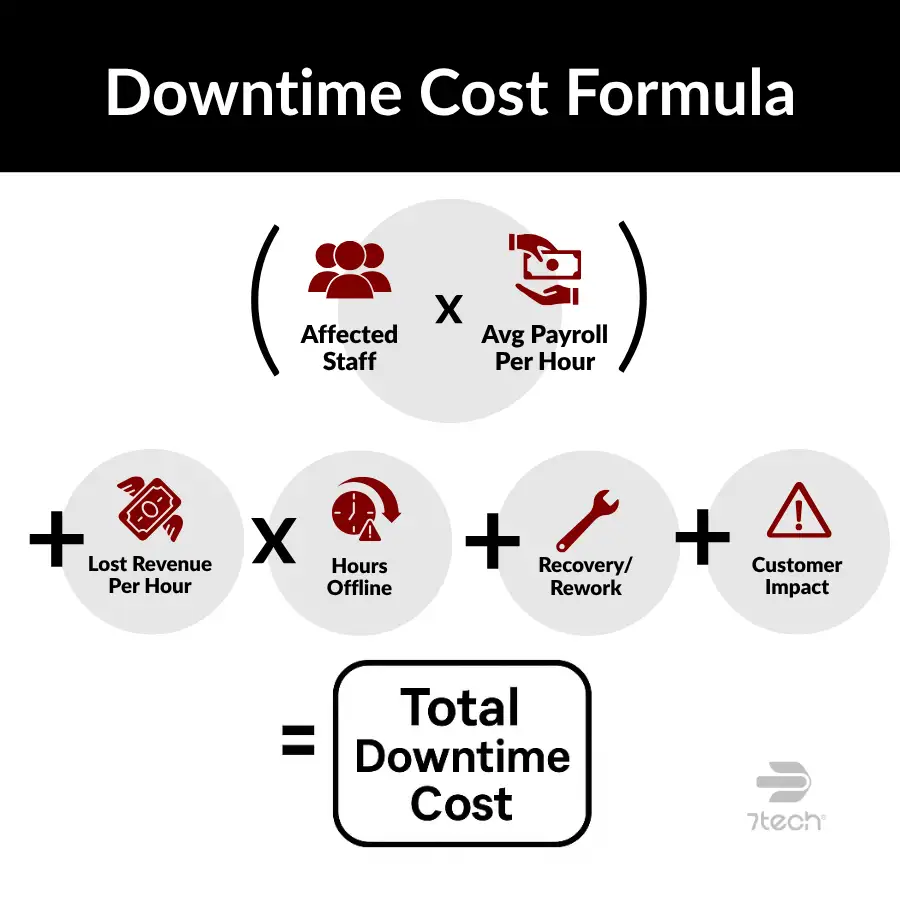
Downtime cost = (Hourly payroll of affected staff + lost revenue per hour) × hours offline + recovery/rework + customer impact.
| Input | Amount |
|---|---|
| Affected staff | 40 |
| Avg payroll per hour | $45 |
| Payroll/hr (40 × $45) | $1,800 |
| Lost revenue per hour | $3,200 |
| Hours offline | 3 |
| Direct cost ((1,800 + 3,200) × 3) | $15,000 |
| Add (not included above): recovery/rework and any customer credits. | |
How to use this formula (and cut the cost of IT downtime)
- Gather inputs: affected staff, avg payroll/hr, lost revenue/hr (or a unit proxy), hours offline.
- Do the math once per incident: (Hourly payroll + lost revenue) × hours offline; then add recovery/rework + customer impact. Track 30 days to find your biggest leaks.
- Act on it: set minutes-to-engage response time, run monthly backup restore tests, and fix recurring causes. (See your Executive Checklist below.)
If your estimated annual downtime cost is greater than what you spend on IT support, you’re paying twice—once for service and again for the failure. That’s why modern businesses are shifting toward zero downtime IT services that prioritize prevention, speed, and resilience.
Is Your IT Hurting Your Bottom Line?
Short answer: If downtime is rising, response times are slow, and invoices are unpredictable, IT is eroding profit. Even “minor” outages add up fast—many organizations report single incidents topping $100,000, and that proportion is increasing.
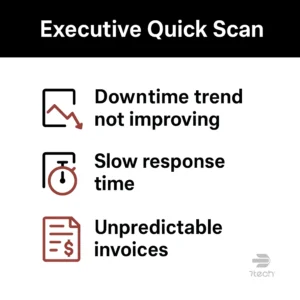
What to check this quarter (executive quick scan):
- Downtime isn’t trending down quarter to quarter.
- Slow response time from support leaves teams idle and projects stuck.
- Unpredictable invoices (surprise fees, vague line items).
If any of these are true, your provider may be a cost center—not a value driver. switch to a proactive model and demand reporting that proves improvement.
See managed IT services built for predictable IT costs for SMBs.
How to Calculate Downtime Cost per Hour (With a Free Template)
- Count people truly affected (not your whole company—just those blocked).
- Estimate hourly payroll (salary ÷ 2080 + benefits burden).
- Estimate lost revenue per hour (pipeline stage delays, missed production, service SLAs you owe customers, etc.).
- Multiply by hours offline and then factor in rework (redoing tasks) and customer impact (credits, refunds, churn).
Want the calculator? We’ll share it during the webinar below, so you can plug in your numbers in minutes.
Free On-Demand Executive Webinar
5 Mistakes Texas Businesses Make That Quietly Draining Profits (and How to Fix Them)
Walk away with a simple plan to reduce downtime, cut waste, and make IT prove its value.
Ransomware & Backup Failures: The Hidden Downtime Multiplier
Backups that aren’t tested don’t count. Run monthly restore tests and align recovery targets with business needs:
- RTO (Recovery Time Objective): how long you can be down.
- RPO (Recovery Point Objective): how much data (time) you can afford to lose.
Tighter RTO/RPO reduce financial impact but require better tooling, process, and budget.
 Response Time That Actually Cuts the Cost of IT Downtime
 Response Time That Actually Cuts the Cost of IT Downtime
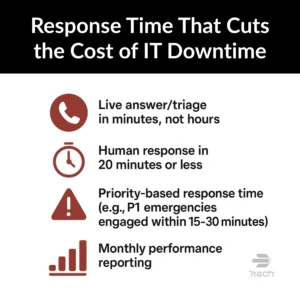
“Fast” isn’t a feeling—it’s a promise you can measure. Ask providers to commit to:
- Live answer/triage in minutes, not hours.
- Human Response in 20-minutes or less.
- Priority-based response time (e.g., P1 emergencies engaged within 15–30 minutes).
- Monthly performance reporting (time to respond, time to resolve, recurring issues).
Why it matters: every extra minute waiting on help is paid payroll with no output. Learn more about why fast IT support matters for your business.
What “99.9% Uptime” Really Means in Lost Hours
Uptime targets sound impressive until you translate them:
- 99.9%: ~8 hours 45 minutes/year of downtime
- 99.99%: ~52 minutes/year
- 99.999%: ~5 minutes/year
| Uptime target | Per year | Per month* | Per week | Per day |
|---|---|---|---|---|
| 99.9% | 8h 45m 36s | ≈ 43m 50s | ≈ 10m 05s | ≈ 1m 26s |
| 99.99% | 52m 34s | ≈ 4m 23s | ≈ 1m 01s | ≈ 9s |
| 99.999% | 5m 15s | ≈ 26s | ≈ 6s | ≈ 1s |
| *Monthly figures use a 30.44-day average month. To estimate cost, multiply downtime (in hours) by your cost per hour. | ||||
If your business can’t tolerate half a day of annual downtime, you need stronger engineering, monitoring, and tested recovery.
Break-Fix vs Managed: Which Model Minimizes Downtime?
Reactive “call-us-when-it-breaks” support often looks cheaper—until outages, rework, and delays stack up. A proactive model with monitoring, patching, tested backups, and capacity planning typically prevents incidents in the first place.
Short answer: Managed (proactive) IT minimizes downtime more consistently than break-fix because it emphasizes prevention (monitoring, patching, tested backups) and fast response time with accountability—an approach smart businesses use to eliminate IT downtime before it drains productivity and profit.
Why proactive wins (evidence-aligned):
- Prevention reduces incidents: Human error and weak procedures are recurrent outage drivers; disciplined operations, monitoring, and regular restore tests cut risk.
- Recovery is faster: Clear priorities and time-to-engage targets shrink the business impact window. (Even tiny availability gains reclaim hours per year.)
- Business alignment: Proactive planning ties RTO/RPO and response commitments to what an hour of downtime actually costs your business.
See the full comparison in managed service vs break-fix and explore our approach to managed IT services.
Why Your IT Bill Is So High With Nothing to Show for It
Short answer: Bills feel high when you’re paying premium rates without fewer outages, quicker engagement on critical issues, and transparent reporting. Meanwhile, real-world outage costs keep climbing—more than half of organizations now peg their most recent significant outage above $100,000. In fact, a joint report from Splunk and Oxford Economics found that downtime now drains nearly $400 billion annually from Global 2000 companies, eroding as much as nine percent of profits.
How to fix it (and lower total cost):
- Tie spend to outcomes: Require monthly proof (uptime %, response time, time-to-resolve, backup success). If trendlines don’t improve, change the model/provider.
- Bundle essentials: Monitoring, patching, and tested backups should not be “extras.” Consolidate under flat-rate, all-in support for predictable IT costs for SMBs.
- Reduce exposure: Translate 99.9% vs 99.99% availability into hours and price the risk—then invest accordingly.
If you’re paying premium prices, you should see:
- Fewer outages and faster recovery when they happen.
- Predictable invoices with clear scope (no nickel-and-diming for basics like monitoring, patching, or tested backups).
- Quarterly reviews that show trends and business alignment.
See red flags to watch for: The 7 Red Flags Your IT Provider Isn’t Protecting You (and How to Prove It)
Next Step: Reduce Downtime with 7tech
7tech helps leaders cut downtime and stop profit leaks—without surprise invoices.
Why 7tech
- U.S.-based experts who speak business, not jargon.
- Fast response time pledge: live triage in minutes for urgent issues.
- Flat-rate pricing for predictable IT costs for SMBs—no nickel-and-diming for essentials like monitoring, patching, and tested backups.
- 60-day money-back guarantee—if we don’t deliver as promised, you don’t pay.
- Proactive prevention: 24/7 monitoring, monthly backup restore tests, capacity planning, and root-cause fixes.
- Executive reporting: uptime, response time, time to resolution, backup success rate—so IT proves its value.
Want a fast, no-pressure review? Book a 15-minute Downtime Risk Assessment—we’ll estimate your cost exposure and give you a short plan to reduce it.
FAQ: Cost of IT Downtime (for SMB Leaders)
What’s the downtime cost formula?
(Hourly payroll of affected staff + lost revenue per hour) × hours offline, then add recovery/rework and customer impact. Example: 40 staff × $45/hr = $1,800/hr payroll; lost revenue $3,200/hr; 3 hours offline → (1,800 + 3,200) × 3 = $15,000, plus rework/credits.
How do I estimate lost revenue per hour?
Use average revenue per working hour (revenue ÷ working hours) for the affected function, or a unit-based proxy (orders/hour, billable rate/hour). If you don’t know it, apply gross margin to sales per hour for a conservative estimate, then adjust for the teams/processes the outage actually blocks.
How much downtime does “99.9% uptime” allow?
About 8 hours 45 minutes per year (≈ 43 minutes 50 seconds/month). For context: 99.99% ≈ 52 minutes/year, 99.999% ≈ 5 minutes/year. Translate these hours into cost using your formula to decide what level you truly need.
What response time should we expect from IT support?
For critical issues, expect engagement within 15–30 minutes, with clear time-to-resolution targets; non-critical requests should be acknowledged quickly and scheduled. Fast, measurable response time reduces paid idle time and downstream rework. See why speed matters in why fast IT support matters for your business.
How do RTO and RPO affect cost?
RTO is the max acceptable downtime; RPO is the max acceptable data loss (time). Tighter targets lower business impact but require stronger backups/replication and process maturity. Set RTO/RPO by comparing their cost to your downtime cost per hour—spend less than what an hour of outage would cost you.
What’s the fastest way to cut downtime this quarter?
Enforce minutes-to-engage response time, implement 24/7 monitoring/patching, and perform monthly backup restore tests. Replace failing assets before they fail, and fix root causes of recurring tickets. A flat-rate, proactive model helps deliver predictable IT costs for SMBs while reducing outage frequency.
Cost of IT Downtime: Executive Checklist (5 Steps)
Use this checklist to lower outage frequency, speed recovery, and keep predictable IT costs for SMBs.
☐ 1) Baseline your true downtime cost (run for 30 days).
- Log each incident: team(s) impacted, hours offline, payroll/hr, lost revenue/hr, recovery/rework.
- Calculate: (Hourly payroll + lost revenue) × hours offline + recovery/rework + customer impact.
- Identify top 2–3 incident types (network, email/M365, internet, line-of-business app).
☐ 2) Set and enforce response time targets.
- Critical issues engaged within 15–30 minutes; define time-to-resolution by priority.
- Track first response time and time to resolution monthly; publish trendlines.
- See why speed matters: why fast IT support matters for your business.
☐ 3) Shift from reactive to proactive operations.
- 24/7 monitoring, automated patching, monthly backup restore tests, lifecycle planning.
- If you’re on break-fix, compare models: managed service vs break-fix and price the gap against your baseline.
☐ 4) Check for provider red flags.
- Unpredictable invoices, slow response time, repeat issues, paying extra for basics.
- If you see them, don’t renew: IT provider red flags.
☐ 5) Standardize on an all-in managed service.
- Includes monitoring, patching, verified backups, and executive reporting (uptime, response time, backup success).
- Flat-rate alignment = predictable IT costs for SMBs. Learn more: managed IT services.
Next step: See The Top IT Solutions for Reducing Downtime and Delays in Growing Businesses to boost productivity and eliminate delays.

Neal Juern, CEO of 7tech, helps business leaders take control of their IT and strengthen cybersecurity without the complexity. Known for his straight-talk, business-first approach, Neal has guided hundreds of executives toward smarter, safer operations through Managed IT Services and Managed Security Services that make sense to people outside the IT department.


")


